Lean production: Little's law, bottleneck and kanban
The seven wastes, Little's law proved with an example, the bottleneck and theory of constraints, takt time, kanban number with an example, continuous improvement.
In the 1950s Toyota, lacking the capital and volumes of its American competitors, developed a different way of producing: little inventory, small batches, continuous flow, daily improvement. The Toyota production system, called lean production in the West, is now applied far beyond the car industry. In this lesson we look at waste, Little’s law with its proof and an example, the bottleneck, takt time, kanban sizing with an example, and continuous improvement.
Waste
The central idea is to distinguish what adds value for the customer from what does not, and to eliminate the latter. Ohno listed seven kinds of waste (muda): overproduction, waiting, transport, unnecessary processing, inventory, motion, defects. Inventory is the most insidious, because it hides the others: a store between two departments covers breakdowns, defects and poor synchronisation, which thus remain unsolved. Reducing it brings problems to the surface, like a falling water level revealing the rocks.
Little’s law
The link between work in progress and times is a general law of systems in steady state (Telecommunication Networks lesson on queueing theory).
Theorem (Little). In a stable system, the average number of items present  , the average output rate
 and the average lead time
 are related by

Proof (idea). Observe the system over a long time  , and draw the number of items present as a function of time. The area under the curve can be computed in two ways: as
 (mean value times duration), or as the sum of the times spent in the system by each item, i.e. the number of items that passed through,
 , times the mean time . Equating and dividing by gives the law; the effects of the items present at the start and end become negligible for large . ∎
Example. A line with 600 items in process and an output of 50 items per hour has an average lead time of 12 hours. To deliver in 4 hours with the same output, work in progress must be reduced to 200 items. The law shows why lean production is also fast: with the same output rate, less inventory means shorter times, and hence faster response to customers, less working capital (Business Economics lesson on budgeting) and defects discovered earlier.
The bottleneck
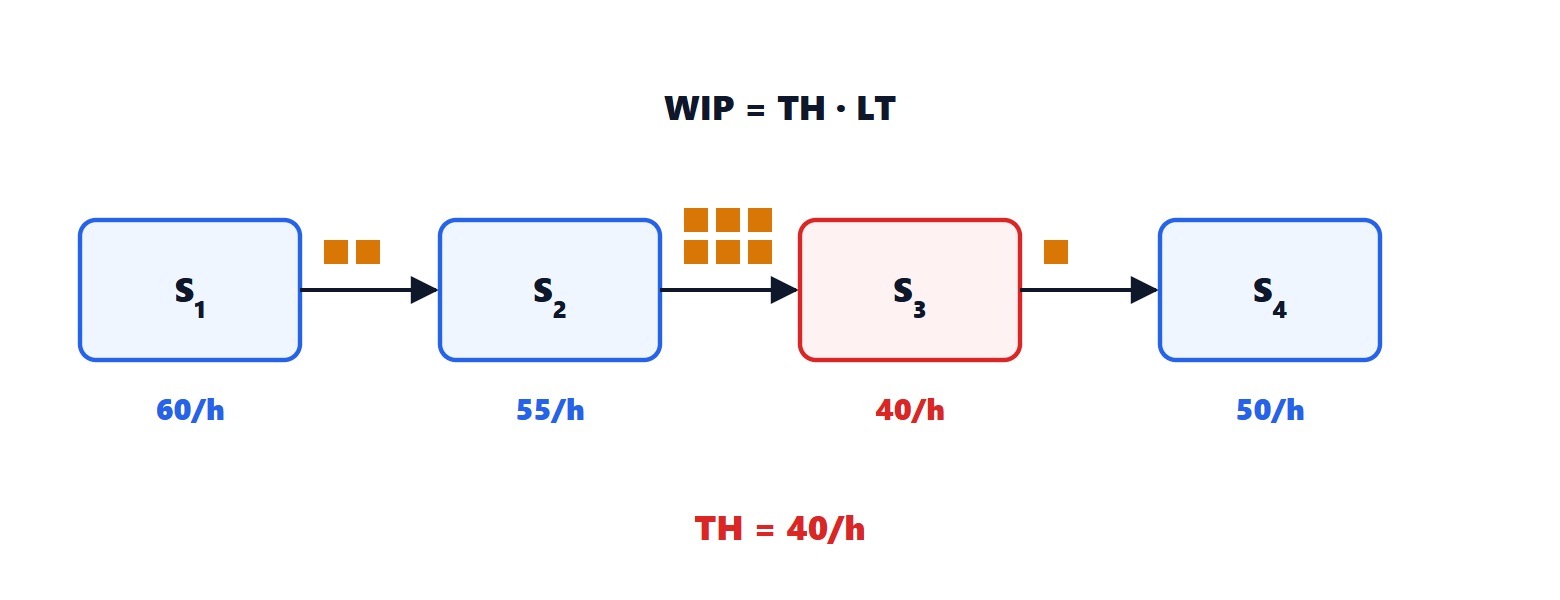
A line’s rate is that of its slowest station, the bottleneck: in the figure 40 items per hour, whatever the capacity of the others. An hour lost at the bottleneck is an hour lost for the whole plant; an hour saved at another station is useless. Goldratt’s theory of constraints draws the rules: identify the bottleneck, exploit it to the full (never idle, never working on defective items), subordinate everything else to its rate, and only then increase its capacity.
Takt and pull flow
Takt time is the pace needed to meet demand:
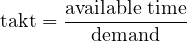
With 450 minutes of work a day and 900 items required, takt is 30 seconds: every station must complete its work in less than 30 seconds, and work must be balanced across the stations.
In pull production a department produces only when the downstream one withdraws: the signal is the kanban, a card attached to a container. The number of cards limits the inventory in circulation:
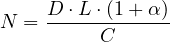
with  the demand per unit time,
 the card cycle time (production plus transport),
 a safety margin and
 the items per container. It is Little’s law again: the inventory needed is rate times time. Example.
 items per hour,
 hours,
 , containers of 20 items:
 cards. Removing one card at a time, when everything works, is the lean way of discovering the next problem to solve.
Continuous improvement
The system rests on kaizen, continuous improvement in small steps by the people who work on the process, and on respect for their contribution. Tools such as value stream mapping, workplace organisation (5S), reduction of changeover times (SMED, which makes small batches economical) and stopping the line at the first defect (jidoka) all serve to bring problems to the surface and solve them at the root.