Quality: control charts, process capability and six sigma
Common and special causes, the mean chart, average run length proved, sensitivity to a shift, Cp and Cpk with an example, six sigma, total quality.
Quality is not obtained by inspecting parts at the end and scrapping the defective ones, but by keeping the process that produces them under control. Statistical tools say when a process has changed and whether it is capable of meeting the tolerances. In this lesson we look at control charts with the proof of the average run length and the calculation of the sensitivity to a shift, capability indices with an example, the meaning of “six sigma”, and quality management.
Variability and statistical control
No process produces identical parts. Shewhart distinguished two kinds of variability: that due to many common causes, small and always present, giving a stable distribution; and that due to special causes (a worn tool, a different batch of material, a wrong setting), which shift the process. A process with only common causes is in statistical control: predictable. The task of control is to detect special causes early, without reacting to normal fluctuations.
The control chart
At regular intervals  parts are sampled, their mean
 is computed and plotted on a chart with a centre line
 and two limits at
 , because the standard deviation of the mean of values is
 .
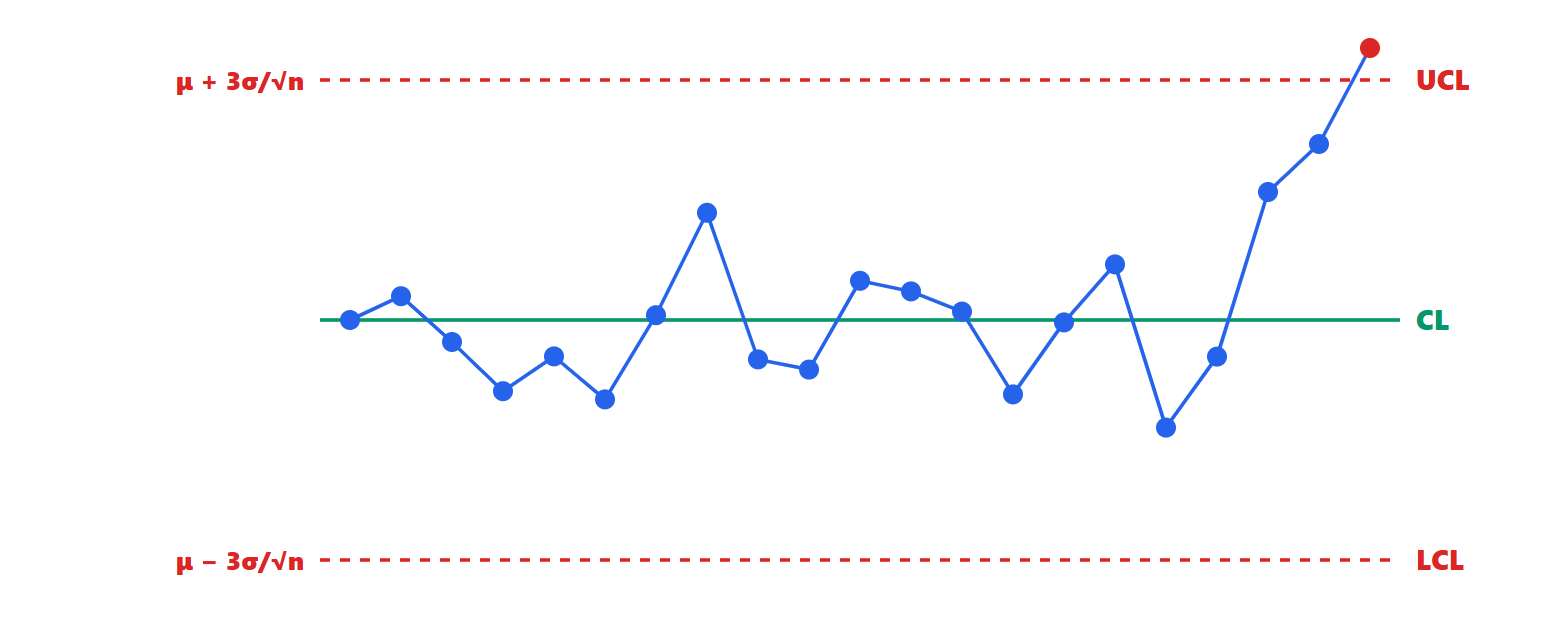
Theorem. With limits at  standard deviations and a process in control with a normal distribution, each point falls outside the limits with probability
 , and the average number of samples before a false alarm is
 .
Proof.  . The samples are independent, so the number of samples until the first signal follows a geometric distribution with success probability
 , whose mean is
 . ∎
The same reasoning measures sensitivity. Example. If the mean shifts by  and samples are of
 parts, the shift amounts to two standard deviations of the mean; a point exceeds the upper limit with probability about
 , and the shift is signalled on average after
 samples. Larger samples or additional rules (for example seven consecutive points on the same side of the centre line) make the chart more sensitive.
Process capability
A process in control can still produce parts out of tolerance, if its variability is too large compared with the specifications 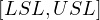 . The capability indices:

 compares the width of the tolerance with that of the process;
 also accounts for centring.
Example. A shaft with nominal diameter 10.00 mm and tolerance ±0.08 mm, produced with  mm:
 . If the process is centred, the out-of-tolerance parts are those beyond
 : about 63 per million. If the mean shifts to 10.02 mm,
 , and the out-of-tolerance parts, beyond
 on the near side, rise to about 1350 per million. Many automotive customers require
 or 1.67.
Six sigma
A “six sigma” process has its tolerance at  from the mean (
 ). The Six Sigma programme, born at Motorola in the 1980s, allows the mean to drift by up to
 in the long run: a distance of
 from the nearest limit then remains, and defects are about 3.4 per million. The improvement method is the DMAIC cycle: define, measure, analyse, improve, control.
Quality management
Total quality extends the idea to the whole company: quality is defined by the customer, it is built into processes and design (not inspected at the end), it involves everyone, and it improves continuously with Deming’s plan-do-check-act cycle. In design, tools such as failure mode and effects analysis (FMEA) prevent defects before they arise; in production, error-proofing devices (poka-yoke) make it impossible to fit a part the wrong way round. The ISO 9001 standard certifies that a company has a documented and audited quality management system. One principle guides everything: a defect costs more the later it is discovered, from design to production to the customer, often by a factor of ten at each step.