Project management: critical path, PERT and earned value
WBS and precedences, minimum duration equal to the longest path proved, slacks with an example, PERT and completion probability, CPI and SPI indices.
Developing a product, building a plant, introducing a new information system are projects: unique activities with a beginning, an end, a budget and a goal. Project management keeps time, cost and scope under control. In this lesson we look at the work breakdown, the critical path method with the proof that the minimum duration is the longest path and an example with the slacks, the PERT method for uncertain durations with the calculation of a probability, and progress control.
Work breakdown
The first step is the WBS (work breakdown structure): the project is broken down into smaller and smaller work packages, until each can be estimated in duration and cost and assigned to an owner. Then the precedences are established: which activities must finish before others can start.
The critical path
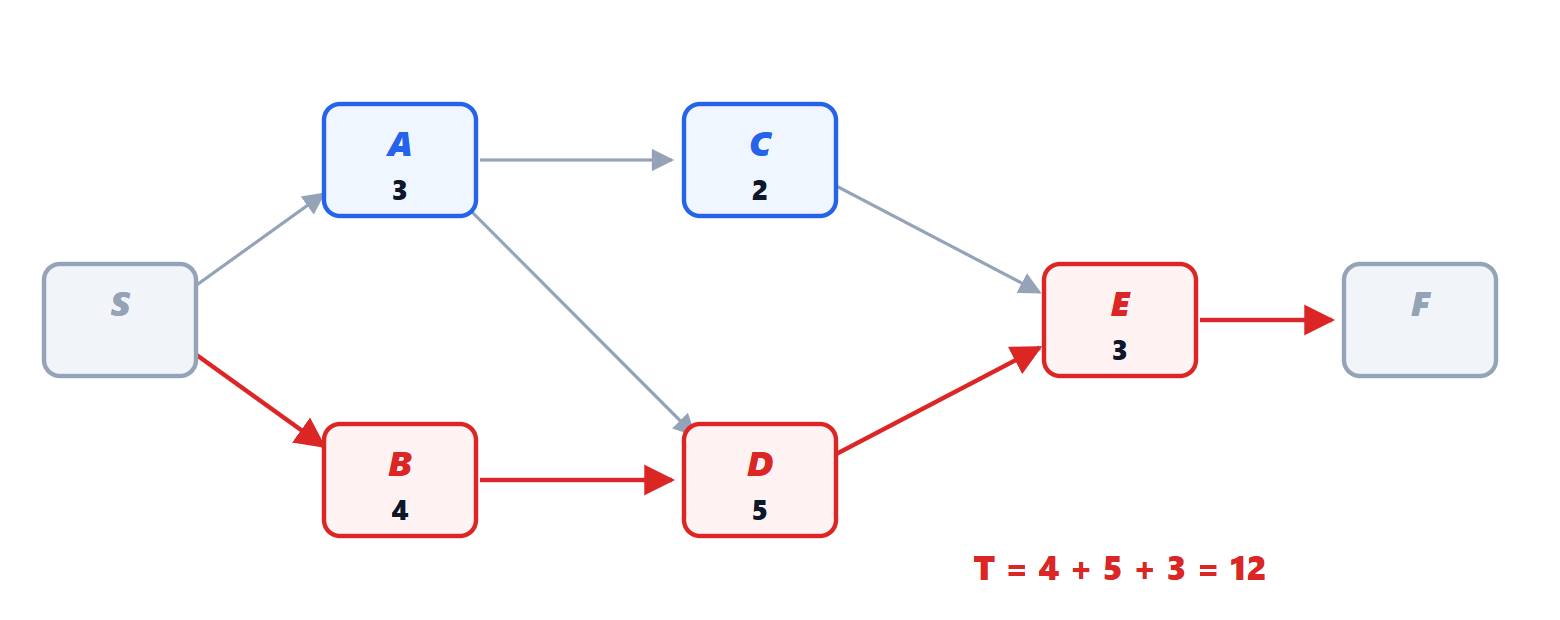
Activities and precedences form a network: each activity is a node with its duration, and arrows indicate precedences.
Theorem. If each activity starts as soon as all its predecessors have finished, the project lasts exactly as long as the longest path (sum of durations) from the start to the end of the network, and no schedule can make it shorter.
Proof. Along any path the activities must take place one after the other, so the project lasts at least the sum of the durations of every path, in particular the longest: this is a lower bound. Scheduling each activity at its earliest start (the maximum of the finish times of its predecessors), one shows by induction along the network that the earliest finish of every activity equals the length of the longest path ending in it: for an activity without predecessors it is its duration; for the others it is the maximum over the predecessors plus its own duration, i.e. the longest path. The final node therefore finishes exactly at the length of the longest path, and the bound is reached. ∎
The longest path is the critical path: a delay in one of its activities delays the whole project. The other activities have slack (float): the delay they can suffer without effect, computed as the difference between latest start and earliest start.
Example. In the network of the figure the paths are A-C-E (8 weeks), A-D-E (11) and B-D-E (12): the critical path is B-D-E, and the project lasts 12 weeks. Working backwards from the end: E must start by week 9, D by week 4, so A must finish by week 4 and start by week 1: A has a slack of 1 week. C must finish by week 9, hence start by week 7, while it can start at week 3: a slack of 4 weeks. To shorten the project one must act on critical activities, for example by adding resources to D; speeding up C is useless.
Uncertain durations: PERT
Durations are estimates. The PERT method asks for three estimates for each activity: optimistic  , most likely
 , pessimistic
 , and uses as mean and variance

(the formulas of an approximated beta distribution). The duration of the critical path is a sum of independent durations: the mean is the sum of the means, the variance the sum of the variances, and by the central limit theorem the distribution is approximately normal (Signal Theory lesson on probability).
Example. For B estimates (2, 4, 6), for D (3, 5, 7), for E (2, 3, 4): means 4, 5 and 3, variances 0.44, 0.44 and 0.11. The critical path has mean 12 and variance 1, i.e. a standard deviation of 1 week. The probability of finishing within 13.5 weeks is  %. Beware: a near-critical path with large variance can become critical, and the method, which looks only at the mean critical path, tends to be optimistic.
Progress control
During the project three quantities are compared: the planned value of the work that should have been done (PV), the value of the work actually done (EV, earned value) and the cost actually incurred (AC). The indices  and
 say whether more is being spent than planned and whether the project is late; for example
 means that every euro spent produces 90 cents of work, and an estimate of the final spend is the budget divided by 0.9. The earned value method flags problems early, while there is still time to correct them.