Characterization of a measuring instrument: static and dynamic specifications
Range, resolution, accuracy, linearity, bandwidth and loading effect explained with worked examples, and how to read a multimeter accuracy spec.
https://www.electronics-engineering.com/articolo_5133-characterization_of_an_instrument.htm
Questo articolo per ora è disponibile solo in inglese. La versione italiana è in preparazione.
Every instrument on a lab bench comes with a datasheet full of numbers: range, resolution, accuracy, input impedance, bandwidth. Reading them correctly is what separates a measurement you can trust from a number that just looks precise. Characterizing an instrument means describing, with those parameters, how its output relates to the quantity you are trying to measure.
It helps to think of the instrument as a block. The measurand goes in, a reading comes out (a needle position, digits on a display, a voltage for a data acquisition card), and along the way the block adds errors, delays and some disturbance to the circuit under test. The parameters fall into two families: static ones, which describe the steady state, and dynamic ones, which describe how the instrument follows a quantity that changes.
Static characteristics
- Range and span. The range is the interval of values the instrument can measure, for example 0 to 20 V. The span is its width, here 20 V.
- Resolution. The smallest change the instrument can show. A 4½ digit multimeter on the 20 V range shows 19.999 V at most, so its resolution is 1 mV. Resolution is not accuracy: a display can show four decimals and be wrong in the second.
- Sensitivity. The ratio between a change in output and the change in input that caused it, such as 10 mV/°C for an LM35 temperature sensor.
- Offset (zero error). The reading when the input is zero. Easy to correct if it is stable, which is why many instruments have a zero or “REL” button.
- Linearity. How far the real input/output curve moves away from a straight line, usually given as a percentage of full scale.
- Hysteresis. A different reading for the same input depending on whether you got there from below or from above. Typical of mechanical gauges and magnetic sensors.
- Repeatability and drift. How much the readings scatter when you measure the same thing several times in a row, and how much they move over hours, days or with temperature.
Accuracy and precision are not the same thing
Precision is about scatter: ten readings that agree to the last digit are precise. Accuracy is about being close to the true value. An instrument with a constant offset can be very precise and still inaccurate. The usual picture is a target: tight grouping away from the centre is precise but not accurate; a wide grouping around the centre is accurate on average but not precise.
Reading an accuracy specification
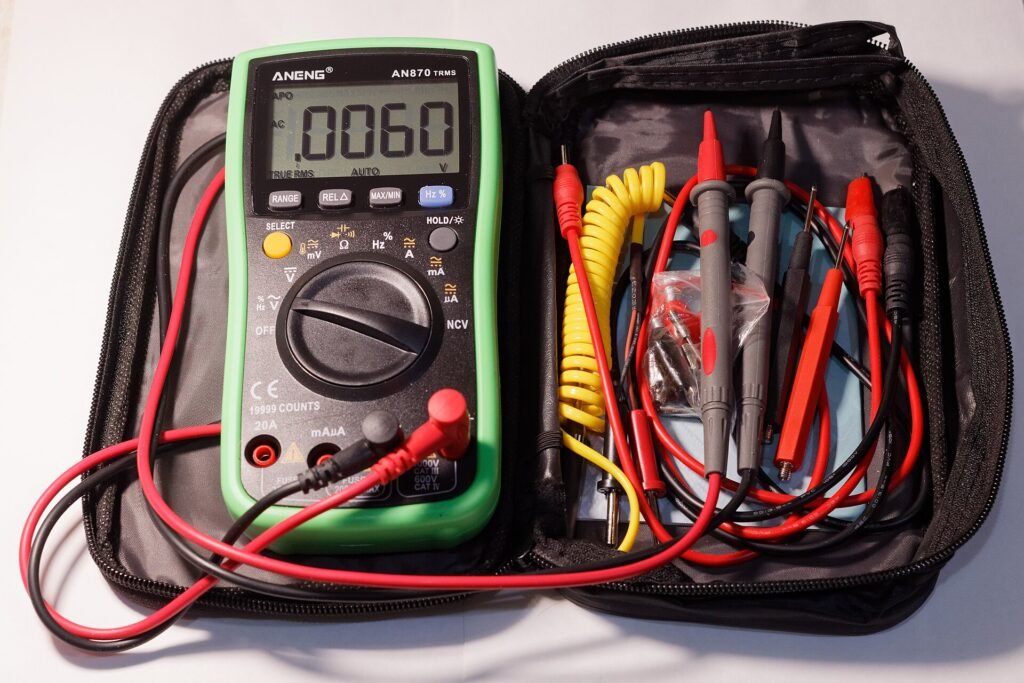
Digital multimeters usually state accuracy as ±(% of reading + digits). Take ±(0.5% + 2 digits) on the 20 V range, with a reading of 12.000 V:
- 0.5% of 12.000 V is 0.060 V;
- 2 digits on this range are 2 × 0.001 V = 0.002 V;
- total: ±0.062 V, so the true value lies between 11.938 V and 12.062 V.
Now measure 0.500 V on the same range: 0.0025 V + 0.002 V = ±0.0045 V, almost 1% of the reading. The fixed part weighs more and more as the reading gets smaller, and that is the practical reason to always use the lowest range that does not overflow.
Analog instruments use an accuracy class instead, a percentage of full scale. A class 1.5 voltmeter on its 300 V scale can be off by 4.5 V anywhere on the scale. Reading 30 V on that scale means an uncertainty of 15%, which is why with analog meters you try to read in the last third of the scale.
Dynamic characteristics
When the measured quantity changes, the instrument needs time to follow it. Many sensors behave like a first order system: after a step, the output reaches 63% of the final value after one time constant τ and is within 1% after about 5τ. A thermocouple in still air may have τ of several seconds, which explains slow readings when you move it from one place to another.
For electronic instruments the key figure is bandwidth. An oscilloscope’s bandwidth is the frequency at which a sine wave is shown 3 dB lower (about 70% of its amplitude). For a first order response the rise time is roughly tr ≈ 0.35 / BW, so a 100 MHz scope has a rise time of about 3.5 ns and cannot show faster edges correctly. The rule of thumb is to pick a bandwidth three to five times higher than the highest frequency you care about. Multimeters have bandwidth limits too: many true RMS meters are specified only up to a few kHz.
The loading effect
Connecting an instrument changes the circuit. A voltmeter with input resistance Rin across a source with internal resistance Rs reads
Vread = V × Rin / (Rin + Rs)
With a typical 10 MΩ multimeter on a node with 1 MΩ of source resistance, the reading is about 9% low. An old analog tester at 20 kΩ/V on its 10 V range (200 kΩ) would be far worse. Ammeters have the opposite problem: their shunt resistance adds to the circuit and lowers the current, and the “burden voltage” in the datasheet tells you how much. Oscilloscope probes add capacitance as well, which matters at high frequency.
Putting it together: uncertainty
A complete result is a value with its uncertainty, for example 12.00 V ± 0.06 V. Modern practice (the GUM, the international guide to uncertainty in measurement) separates two kinds of contribution: type A, estimated statistically from repeated readings, and type B, taken from other information such as the datasheet, the calibration certificate or the resolution. Independent contributions are combined as the square root of the sum of squares. In a typical lab exercise with a good multimeter, the datasheet accuracy dominates and the scatter of the readings is much smaller.
For a worked example with real measurements, see the lab report on electrical measurements, and for how to present results, the guide on writing a good lab report (both in Italian).




Hi, I am the author of “Characterization of a measuring instrument: static and dynamic specifications”. Questions, doubts, error reports and requests for more detail are all welcome: write them below and I will answer. You can also rate the page with the stars at the top of the article.