Receiver noise: noise figure, sensitivity and Friis's formula
Structure of a communication system, decibels and dBm, thermal noise at −174 dBm/Hz, noise figure and equivalent temperature, sensitivity, Friis's formula with proof, link margin.
A communication system carries information from a source to a destination through a channel that attenuates, distorts and adds noise. Designing a link often comes down to one question: does the signal reach the receiver sufficiently stronger than the noise? In this lesson we look at the general structure of a system, decibel units, receiver noise with noise figure and equivalent temperature, and Friis’s formula for chains of stages.
The structure of a system
Transmitter: the source produces the information, the source encoder compresses it, the channel encoder adds redundancy to correct errors, the modulator turns it into a signal suited to the channel. The channel (a cable, a fibre, free space) attenuates and disturbs. The receiver goes back along the chain: demodulator, channel decoder, source decoder. The Signal Theory lessons covered modulation and detection; here we look at the system from the point of view of the engineer who must make it work.
Decibels
In communications quantities span many orders of magnitude, and decibels are used: a power ratio  is
 dB. Absolute powers are expressed relative to one milliwatt: dBm. 0 dBm = 1 mW, 30 dBm = 1 W, −90 dBm = 1 pW. The advantage is that cascaded gains and losses add: a 20 dBm transmitter, a 2 dBi antenna, 80 dB of free-space path loss and a 2 dBi receiving antenna give
 dBm (Electromagnetic Fields lesson on antennas).
The noise floor
Any resistance at temperature  produces thermal noise with available power density
 (lesson on random processes). At
 K:

It is the most important number in radio communications. Over a bandwidth  the noise power is
 : in 20 MHz (a Wi-Fi channel) it is
 dBm. No receiver can do better.
Noise figure
Every stage of a receiver adds its own noise. The noise figure  measures how much the signal-to-noise ratio worsens through it:

An ideal amplifier has  (0 dB). Equivalently the equivalent noise temperature
 is used: the noise added by the stage is what a resistance at temperature
 at the input would produce. An amplifier with NF = 1 dB has
 K. Equivalent temperature is preferred for very low-noise receivers, such as satellite and radio-telescope ones.
Sensitivity. The minimum signal a receiver can demodulate is

Example. 20 MHz bandwidth, NF = 5 dB, minimum SNR 10 dB:  dBm.
Friis’s noise formula
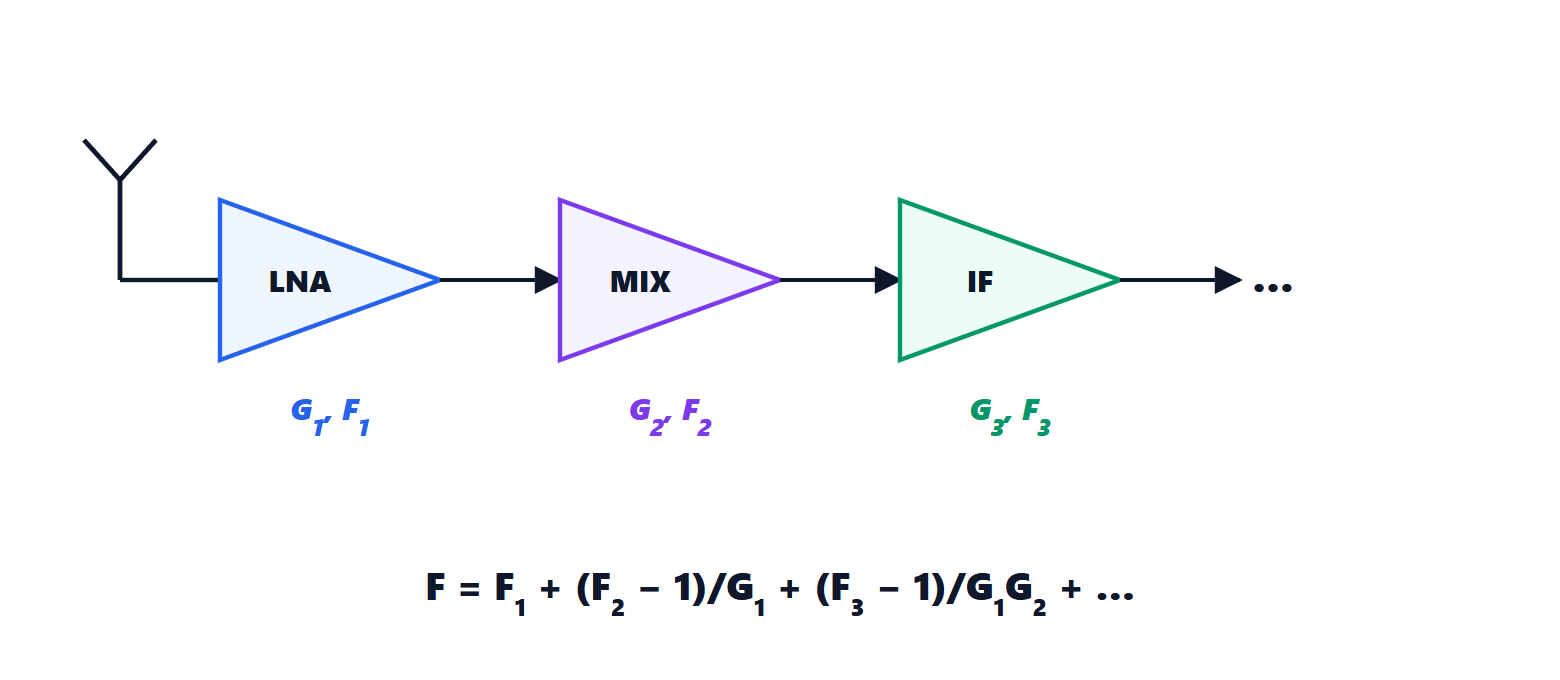
Theorem. The noise figure of cascaded stages is

Proof. Refer everything to the input. The first stage adds noise equivalent to  . The second adds
 at its input, where the signal has already been amplified by
 : referred to the first stage’s input it is
 . Likewise the third contributes
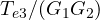 . So
 , and with the formula follows. ∎
The consequence. The first stage almost alone matters, as long as it has enough gain. With a low-noise amplifier (LNA) of NF = 1 dB and 20 dB of gain, followed by a 10 dB mixer with 6 dB of loss and a 4 dB amplifier, the overall figure is about 1.5 dB. With the mixer first, it would be over 10 dB: 9 dB of sensitivity lost: in free space the range would drop to about a third. That is why LNAs are placed as close as possible to the antenna, and in satellite dishes they sit in the converter mounted right at the focus.
Passive losses before the first amplifier (a cable, a filter) also have a noise figure equal to their attenuation: 2 dB of cable before the LNA add 2 dB to the system noise figure.
The complete link budget
Putting together transmitted power, antenna gains, propagation losses and receiver sensitivity gives the link margin: how many extra decibels of attenuation (rain, walls, fading) can be tolerated. A Wi-Fi link with −56 dBm received and −86 dBm sensitivity has 30 dB of margin; a satellite link often works with a few decibels, and modern systems continuously adapt modulation and coding to the available margin.