Studying the graph of a function: step-by-step procedure with a full example
Domain, sign, limits and asymptotes, first and second derivatives, maxima, minima and inflection points, with a full study of x times e to the minus x and maximum power transfer.
Sketching the graph of a function brings the whole course together: domain, limits, derivatives, monotonicity, concavity. The goal is a correct qualitative graph, with asymptotes, maxima, minima and inflection points in the right place, without computing hundreds of points. Here is the procedure step by step, applied to a complete example.
The steps
- Domain and any symmetry (even, odd, periodic).
- Intercepts with the axes and sign of
 .
- Limits at the ends of the domain and asymptotes (vertical, horizontal, oblique).
- First derivative: where it exists, where it vanishes, its sign. This gives intervals of increase, maxima and minima, corners or cusps.
- Second derivative: its sign, hence concavity and inflection points.
- Graph, checking that everything is consistent.
Concavity: where  the graph is convex (opening upwards, like
 ), where
 it is concave. An inflection point is where the concavity changes.
A complete example: 
1. Domain. All of  . No symmetry:
 is neither
 nor
 .
2. Intercepts and sign.  only at
 . Since
 , the sign is that of
 : negative for
 , positive for
 .
3. Limits. As  : and
 , so
 . Oblique asymptote check:
 , so there is none. As
 :
 (the exponential beats the power), horizontal asymptote
 .
4. First derivative.  . It vanishes at
 , is positive for
 and negative for
 . So increases up to 1 and then decreases: absolute maximum at
 .
5. Second derivative.  . Negative for
 (concave), positive for
 (convex): inflection point at
 .
6. Graph. It comes up from  on the left, crosses the origin with slope
 , rises to the maximum at , goes down, changes concavity at
 and flattens towards the axis without ever touching it. This shape, a quick rise and a slow return, is the response of a critically damped RLC circuit to an impulse.
Useful checks
- The sign of
 must agree with the limits: if
 on the right, eventually the function must increase.
- Between two consecutive maxima there is always a minimum (for a continuous function on an interval).
- A horizontal asymptote can be crossed by the graph: it is not a barrier, it only describes the behaviour at infinity.
- Where is not differentiable (roots, absolute values) compute the right and left derivatives to see whether there is a corner or a cusp.
Maxima and minima on a closed interval
For absolute extrema on  it is enough to compare the value of at the interior stationary points, at the points where it is not differentiable and at the endpoints
 and
 . This is the “engineering” version of graph sketching: for example, the power delivered to a load
 by a source with internal resistance
 is
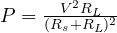 . Differentiating with respect to gives the maximum at
 : the maximum power transfer theorem.