Financial ratios and leverage
ROE, ROI, ROS and turnover, the ROI decomposition, the financial leverage formula proved with an example, liquidity and solvency ratios, net financial position.
Is a profit of one million a lot or a little? It depends on how much capital was needed to produce it, how much was sold, how the company is financed. Financial ratios answer by comparing quantities with each other. In this lesson we look at profitability ratios, the decomposition of ROI into margin and turnover, the proof of the financial leverage formula with an example, and liquidity and solvency ratios.
Profitability ratios
- ROE (return on equity)
 : what the shareholders’ capital earns; compared with the return on alternative investments of similar risk.
- ROI (return on investment)
 : what the capital invested in the business
 earns, whatever its source; it measures the quality of operations.
- ROS (return on sales)
 : how much operating result remains for each euro of sales
 .
- Capital turnover
 : how many times capital “turns” into sales in a year.
Theorem.  .
Proof. 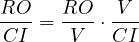 , multiplying and dividing by . ∎
The decomposition shows two roads to the same profitability: a supermarket has low margins (ROS of 2-3 %) and very high turnover; a maker of special machinery high margins and low turnover.
Financial leverage
Invested capital is financed partly by the shareholders ( ) and partly by interest-bearing debt (
 ), at an average rate
 . Assume for simplicity
 and neglect taxes.
Theorem (financial leverage).

Proof. Without taxes and extraordinary items the net result is the operating result less interest:  . Dividing by :

∎
With taxes, at rate  , everything is multiplied by
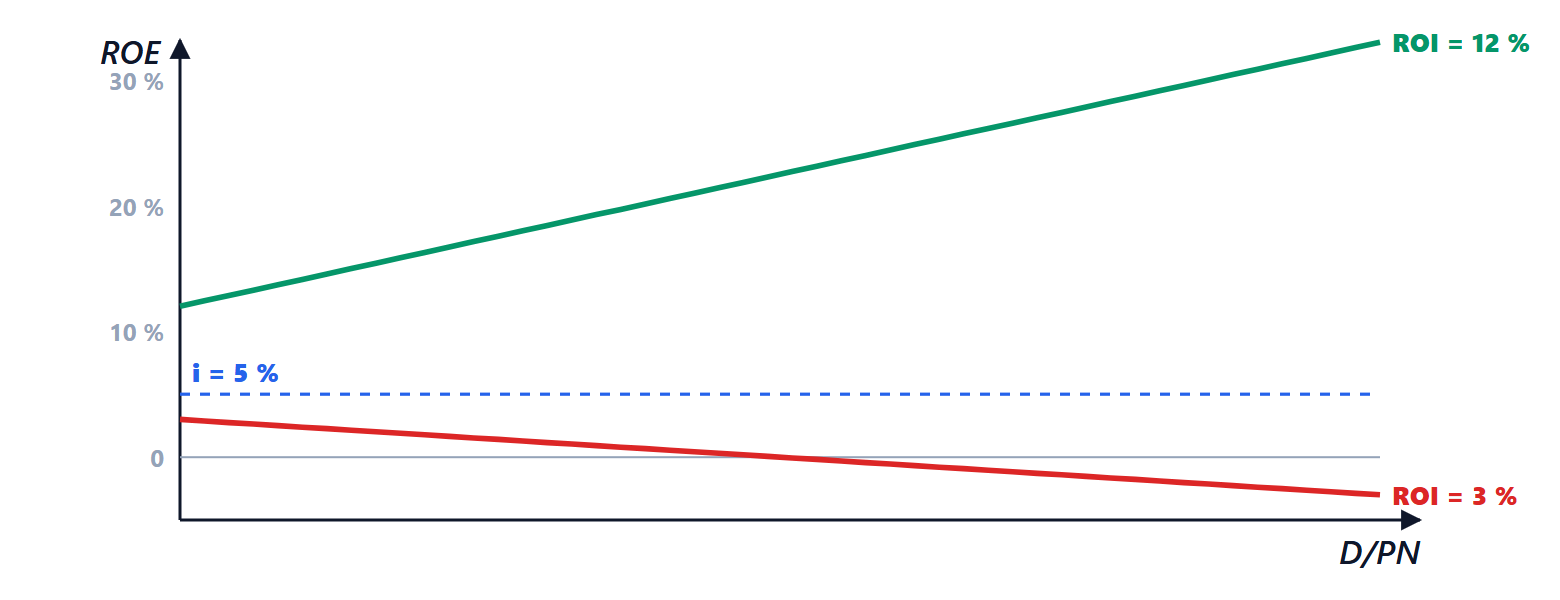
 . The formula says that debt amplifies: if the business earns more than debt costs (
 ), every euro borrowed adds return for the shareholders; if it earns less, it takes return away.
Example. ROI of 12 %, rate of 5 %,  :
 %. If a drop in sales brings ROI down to 3 %,
 %: the shareholders earn nothing, whereas without debt they would have had 3 %. Leverage increases expected return and risk together; this is why banks look at the debt ratio and the cost of debt rises as it grows (lesson on financing).
Liquidity and solvency
- Current ratio
 : above 1, better around 1.5, depending on the sector.
- Quick ratio
 : excludes inventory, which cannot always be sold quickly.
- Debt ratio
 and interest cover
 : how many times the operating result covers interest.
- Net financial position: financial debt minus cash; often related to EBITDA (NFP/EBITDA), indicating in how many years operations could repay the debt.
- Average days of collection, payment and inventory (lesson on budgeting and cash).
Ratios are read together, over time (the trend counts more than one year’s value) and in comparison with companies in the same sector. An isolated ratio can mislead: a very high ROE can hide equity reduced by earlier losses.