Properties of pure substances: phase change, vapour quality and ideal gases
The state of a pure substance, the T-v diagram and saturation dome, the critical point, vapour quality with an example, latent heat, thermodynamic tables, ideal and real gases.
Using the energy balance requires the values of enthalpy, internal energy and specific volume of the fluids in the states of interest. For gases far from condensation the ideal gas laws are enough; for water and refrigerants, which change phase in plants, diagrams and tables are needed. In this lesson we see how the state of a pure substance is described, phase change, the vapour quality and how the tables are read.
The state of a pure substance
For a pure substance in a single phase, two independent quantities (for example pressure and temperature) are enough to fix all the others. During a phase change, however, pressure and temperature are not independent: water at 1 atm boils at 100 °C, at 2 atm at about 120 °C (that is exactly why a pressure cooker cooks faster), in high mountains below 100 °C.
The T-v diagram
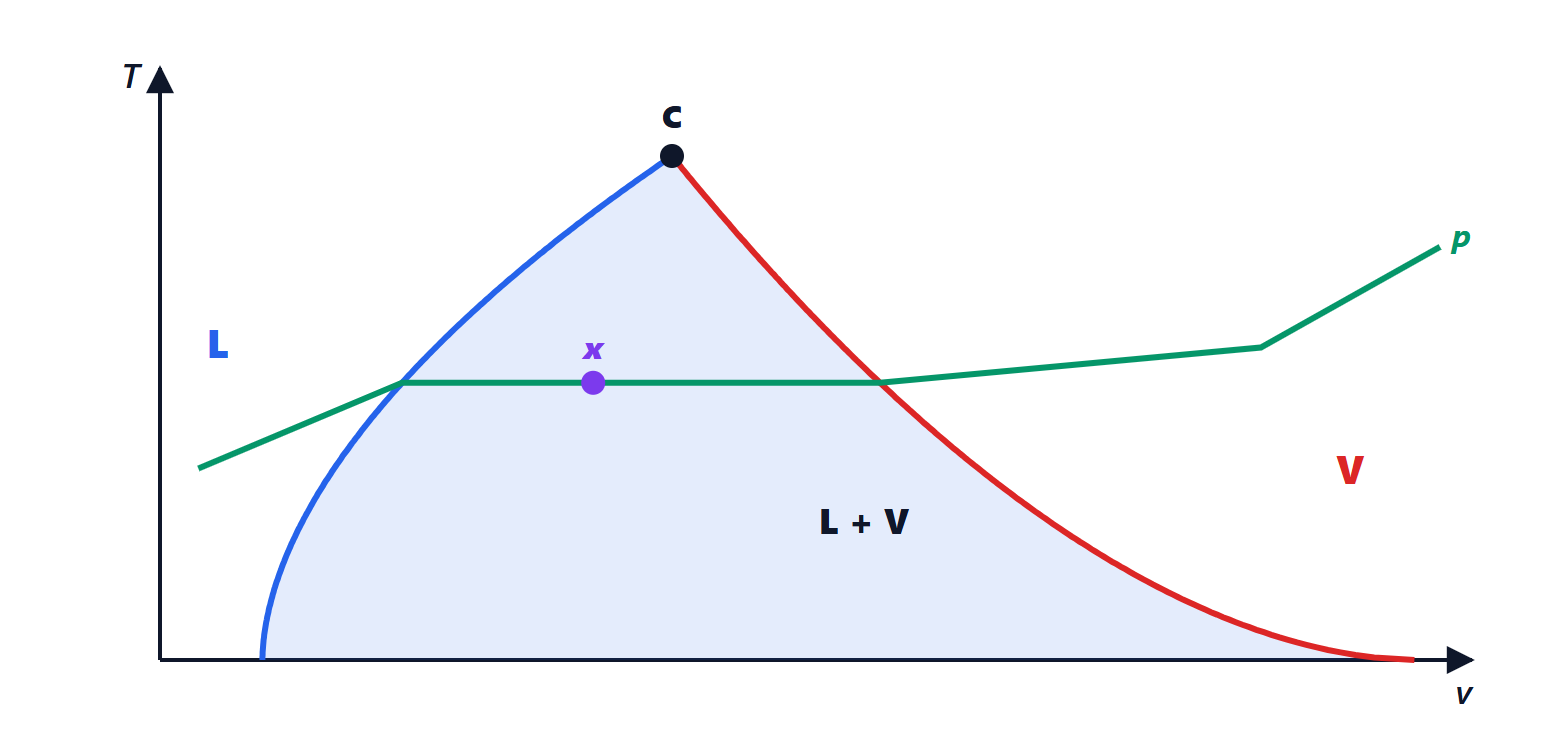
Following an isobar from left to right (heating at constant pressure):
- subcooled liquid: the temperature rises, the volume changes little;
- saturated liquid: boiling begins;
- wet vapour (under the dome): liquid and vapour coexist, the temperature stays constant and all the heat goes into evaporation;
- dry saturated vapour: the last drop has evaporated;
- superheated vapour: the temperature rises again.
Above the critical point (for water 374 °C and 22.1 MPa) there is no longer a distinction between liquid and vapour: the fluid passes continuously from one to the other. The most modern power stations work precisely above the critical point (supercritical cycles).
Vapour quality
Under the dome the state is described by the quality  , the mass fraction of vapour: 0 for saturated liquid, 1 for dry saturated vapour. Every specific quantity is the weighted average of the values of the two phases:

where  is the latent heat of vaporisation.
Example. Water at 100 °C with quality 0.5: from the tables  m³/kg and
 m³/kg, so
 m³/kg. A kilogram of this mixture takes up more than 800 litres, almost all of it vapour, even though the two phases are equal in mass.
The latent heat of water at 100 °C is about 2257 kJ/kg: evaporating a kilogram of water takes more than five times the energy needed to heat it from 0 to 100 °C (419 kJ). This is why steam carries so much energy, and why evaporative cooling (sweat, cooling towers, the heat pipes of laptops) is so effective.
Tables
The thermodynamic tables of water and refrigerants come in two kinds:
- saturation tables, as a function of temperature or pressure: they give the saturation pressure (or temperature) and the values of
 ,
 ,
 for saturated liquid and dry saturated vapour;
- superheated vapour tables, with two entries (pressure and temperature).
The procedure is always the same: with two known quantities, work out which region the state is in (for example by comparing the temperature with the saturation temperature at the given pressure), then read or interpolate the values. Today programs and libraries that compute properties are often used instead of paper tables, but the reasoning does not change.
Ideal gases
Far from the dome (high temperatures, low pressures) gases follow to a good approximation

with  J/(mol·K) and
 the molar mass (for air
 J/(kg·K)). Internal energy and enthalpy depend only on temperature:
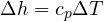 ,
 , with
 . For air
 J/(kg·K) and
 . How far a real gas departs from ideal behaviour is given by the compressibility factor
 , which is 1 for an ideal gas and moves away from 1 near the critical point.