The spectrum of digital signals and rise time
Harmonics of a trapezoidal clock, the 20 and 40 dB per decade envelope proved, a numerical example on rise time, slew rate, spread-spectrum clocks, differential signals.
Almost all the emissions of a digital device arise from its signals: clocks, buses, drive lines of power switches. They are nearly rectangular waves, and their spectrum extends much higher than the clock frequency. How high depends above all on the rise times. In this lesson we look at the spectrum of a trapezoidal wave with the proof of its envelope, the role of the rise time with a numerical example, and how to reduce it without compromising operation.
The trapezoidal wave
A real clock is a periodic wave with period  , amplitude
 , pulse duration
 (measured at half amplitude) and rising and falling edges lasting
 . Its harmonics, at frequencies
 , have amplitudes (Fourier series, Mathematical Methods lesson on the Fourier transform)

Theorem. The envelope of the harmonics is flat up to  , decreases by 20 dB per decade between
 and
 , and by 40 dB per decade beyond
 .
Proof. A trapezoid is obtained by convolving a rectangle of duration with a rectangle of duration (normalised to unit area): the convolution “rounds off” the edges of the first into ramps lasting . The spectrum of a convolution is the product of the spectra, and the spectrum of a rectangle of duration  is a
 function with
 : hence the two factors of the formula. Each is about 1 for
 and is bounded by
 for
 , because
 . The first factor starts falling as
 (20 dB per decade) from
 , i.e. from ; the second adds another from . Beyond the two factors together give
 , i.e. 40 dB per decade. ∎
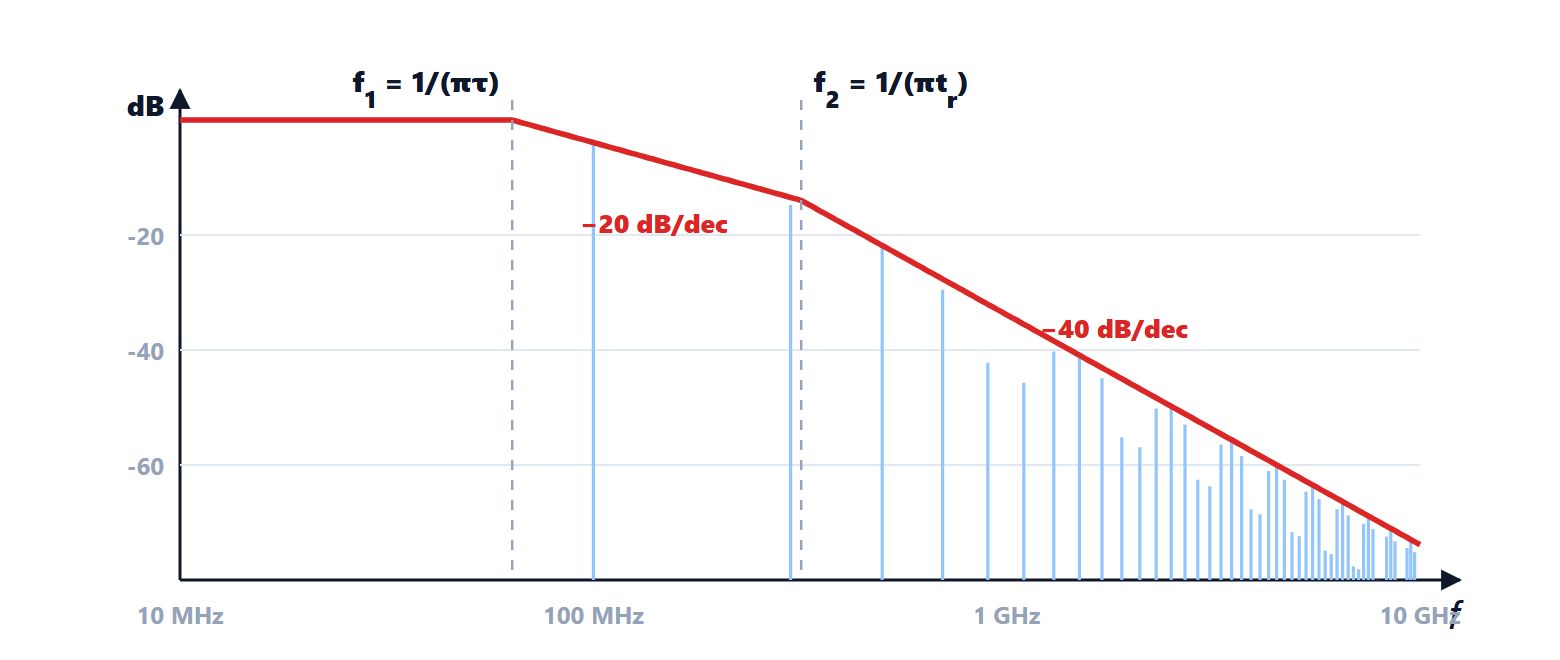
With a 50 % duty cycle the even harmonics vanish, because the first factor vanishes for integer  .
The role of rise time
The envelope shows the key point: above the spectrum falls rapidly, and depends only on the rise time, not on the clock frequency.
Example. A 100 MHz clock,  V,
 ns,
 ns:
 MHz,
 MHz. The first harmonic is
 V. At 1 GHz the envelope has fallen by
 dB up to , plus
 dB: in total about 34 dB below the flat level. With 0.1 ns edges, instead, rises to 3.2 GHz and at 1 GHz the spectrum is only 24 dB below: 10 dB more emission, with the same clock.
This is why fast logic is “noisier” even when it runs slowly: a modern microcontroller has edges of a few hundred picoseconds even if its clock is at 16 MHz.
A practical rule relates rise time and bandwidth: the significant bandwidth of a digital signal is about  (with the rise time measured between 10 and 90 %), the same relation between rise time and bandwidth as for a first-order system (lesson on time response).
How to reduce the spectrum
- Slower edges: the outputs of microcontrollers and FPGAs often have a programmable slew rate; where speed is not needed, the minimum is chosen. A series resistor of a few tens of ohms at the output forms a low-pass filter with the line capacitance and slows the edges; it also matches the impedance and damps reflections (lesson on transmission lines).
- Spread-spectrum clocks: the clock frequency is slowly modulated by a few per cent, for example with a triangular wave. The energy of each harmonic spreads over a wider band and the measured peak, which is what standards limit, drops by 6-20 dB. Logic operation does not change, but timing margins do, and spreading must not be used where an exact frequency is needed (communications, converters).
- Fewer simultaneous transitions: outputs switching together demand current peaks from the supply, causing “ground bounce” and emissions; buses are designed with encodings or staggered delays.
- Differential signals such as LVDS: two wires with opposite currents produce fields that cancel at a distance (lesson on radiated emissions).
Reducing the spectrum at the source is the first step; what remains must be controlled along the path: printed circuit board design, filters and shields.